Interactive Plotly Viewer
Overview
The Interactive Plotly Viewer provides instant, interactive visualization of oscilloscope data using Plotly.js in a new browser window. This feature allows you to explore your circuit simulation results with powerful zooming, panning, and data export capabilities.
- ✅ One-Click Viewing - Open all scopes or individual scopes instantly
- ✅ Interactive Graphs - Zoom, pan, hover for values, export as PNG
- ✅ Range Slider - Navigate through entire time series with ease
- ✅ No File Downloads - Data embedded directly in the viewer
- ✅ Multiple Scopes - View all scopes at once, each in its own panel
- ✅ Download Options - Export all data as JSON or CSV from the viewer
Quick Start
View All Scopes
From the Menu:
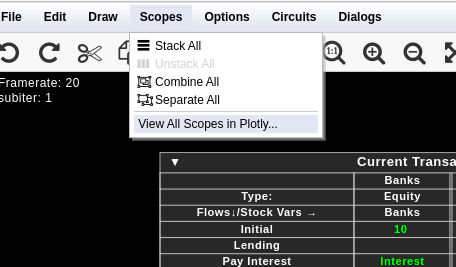
- Click Scopes menu in the top menu bar
- Select “View All Scopes in Plotly…”
- Click “Open Viewer” in the dialog
- A new browser window opens with all scope graphs
View Single Scope
From Right-Click Context Menu:
- Right-click on any scope in your circuit
- Select “View in Plotly…” from the context menu
- Click “Open Viewer” in the dialog
- A new browser window opens showing just that scope
Interactive Features
Zooming and Panning
Zoom: - Click and drag to zoom into a region - Double-click to reset zoom - Use the range slider for coarse navigation
Pan: - Shift + drag to pan across the graph - Use scrollbar if available - Drag the range slider window
Data Inspection
Hover Information: - Hover over any trace to see exact values - Tooltip shows time and value - Compare multiple traces simultaneously
Legend Controls: - Click legend items to show/hide individual traces - Double-click to isolate one trace - Useful for analyzing specific signals
Export Options
Image Export: - Click the camera icon in the Plotly toolbar - Export current view as high-quality PNG - Configurable resolution and filename - Perfect for documentation and presentations
Data Download: - Download All Data (JSON) - Structured format for processing - Download All Data (CSV) - Spreadsheet-compatible format - Both buttons available in the viewer interface
Viewer Layout
Each scope appears in its own panel with:
┌─────────────────────────────────────────┐
│ Scope Name/Title │
├─────────────────────────────────────────┤
│ Metadata: Export type, samples, timing │
├─────────────────────────────────────────┤
│ │
│ Interactive Plot with Legend │
│ │
├─────────────────────────────────────────┤
│ Range Slider (timeline overview) │
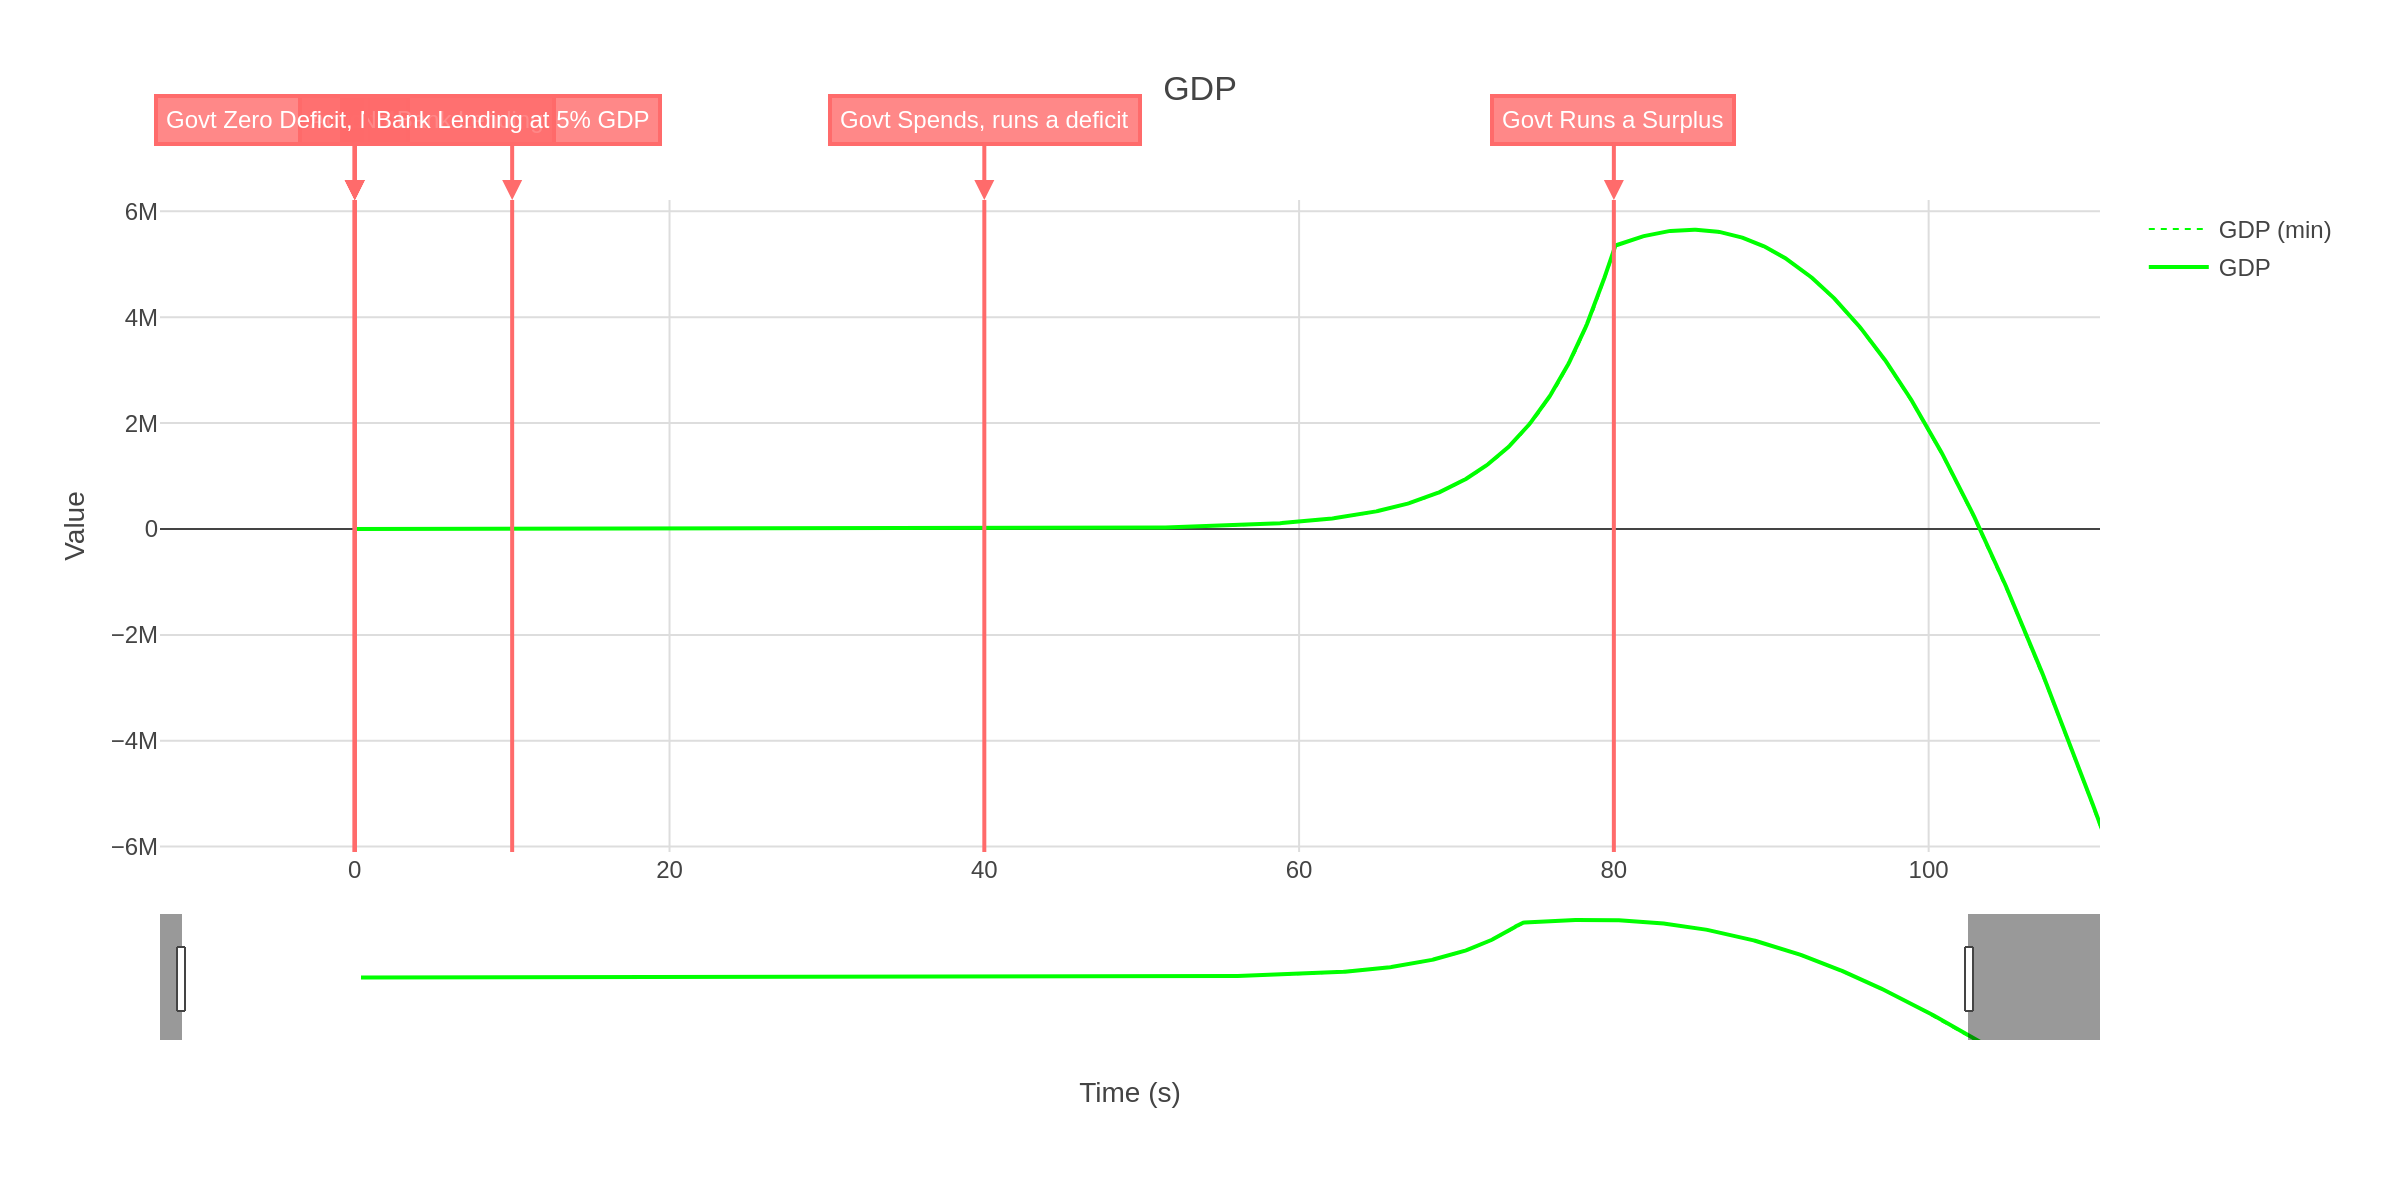
└─────────────────────────────────────────┘Color Preservation
The viewer maintains the same colors used in CircuitJS1:
- Plot colors match CircuitJS1 scope displays
- Min/max traces shown (if different)
- Dotted lines for min values
- Solid lines for max values
- Easy visual correlation
Data Sources
Automatic Mode Selection
The viewer automatically selects the best data source:
When enabled with history available: - Exports full history from t=0 - Can include thousands of points - Shows complete simulation timeline - Ideal for detailed analysis
Standard mode: - Exports visible circular buffer data - Typically 128 sample points - Shows recent simulation window - Fast and responsive
Data Included
For each scope, the viewer includes:
- Scope name (from title or custom label)
- All visible plots
- Time arrays (calculated from simulation time)
- Min and max value arrays
- Units (V, A, Ω, W)
- Plot colors
- Metadata (sample count, timing information)
Troubleshooting
Pop-up Blocked
New window doesn’t open after clicking “Open Viewer”
Solution:
Allow pop-ups for CircuitJS1 in your browser settings. Look for the blocked pop-up icon in your address bar.
Plotly Not Loading
Viewer opens but graphs don’t appear
Solution:
Check your internet connection. Plotly.js loads from a CDN (Content Delivery Network). If offline, the graphs won’t render.
No Data Shown
Viewer opens but shows empty or blank graphs
Solution:
- Ensure scopes have visible plots enabled - Check that simulation has run for some time - Verify scope isn’t displaying empty channels - Try running the simulation longer to collect data
Advanced Tips
Analyzing Multiple Signals
When viewing all scopes:
- Use the legend to selectively show/hide traces
- Compare timing between different scopes
- Correlate cause and effect across circuits
- Export images of multi-scope views
Presentation-Ready Exports
To create publication-quality images:
- Adjust zoom to show region of interest
- Use legend to hide unnecessary traces
- Click camera icon in Plotly toolbar
- Select desired resolution
- Save with descriptive filename
Technical Implementation
For developers interested in the implementation:
- ScopeViewerDialog.java - Dialog and HTML generation logic
- Scope.java - Export methods for JSON/CSV data
- CirSim.java - Menu integration
- ScopePopupMenu.java - Context menu items
See the Contributing Guide for more details on the codebase.